It replaces political calculation with ROI calculation formulating decisions based on achieving a better return on investment.
Working over twenty five years in America’s financial sector for both large and small companies and now as the director of research and strategy for a $10 billion institutional investment fund manager, I have experienced firsthand what drives economic growth, what stimulates job and wage growth. And I’ve seen up close both how the financial sector operates and its role within the economy. My experience also includes advising the Chicago and Washington, D.C. districts of the U.S. Federal Reserve as well as CalPERS, the largest U.S. public pension fund.
Economic reports containing mixed signals along with highly varied interpretations of the reports are creating conflicting views on the economy.
Some interpretations focus on levels noting the currently depressed economic levels. Conversely, others focus on the trends noting the economic rebound occurring.
Based on the questions I am receiving; this is creating confusion and frustration among individuals trying to make sense of the economic environment.
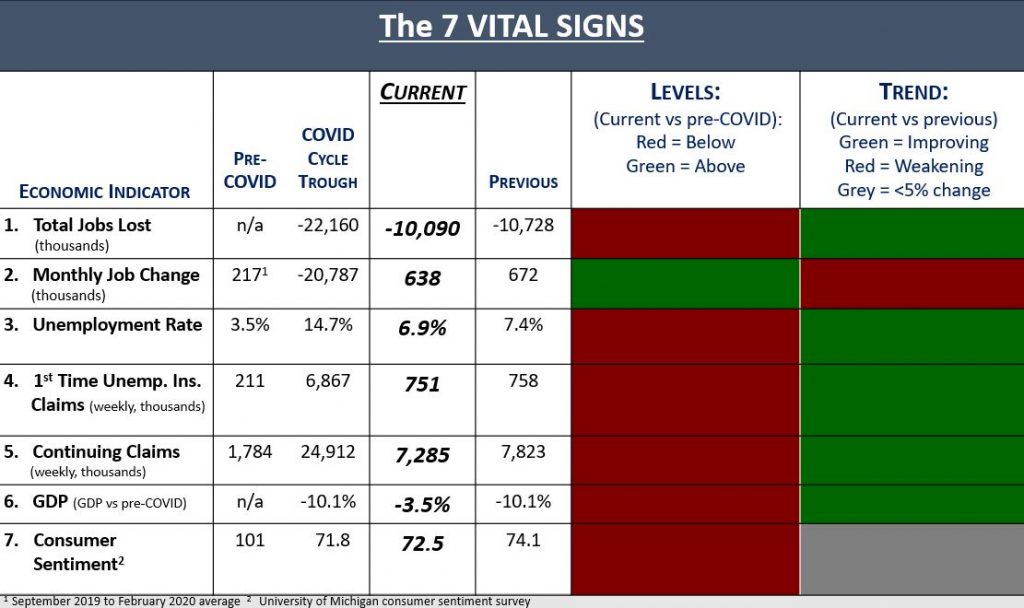
Taking a page from the medical profession, much like when your
vital signs are taken during doctor visits, Solutionomics presents seven vital economic
signs below. They provide a fact-based
picture of the economy, both from a levels and trends perspective, leaving the interpretation
to a separate Solutionomics series, “Prognosis”.
Importantly, just as there are a limited number of vital signs taken during a doctor visit, Solutionomics limits the vital economic signs tracked. This sharpens the focus on the most important economic indicators as opposed to a “data dump” that buries the key indicators among a sea of stats. This also lessens information overload which may be another factor adding to investor confusion.
Economic levels remain depressed relative to pre-COVID levels in six of the seven vital economic signs
Conversely, five of the seven vital signs are improving while the pace of job gains is weakening and the recovery in consumer sentiment remains tepid at best.
Employment
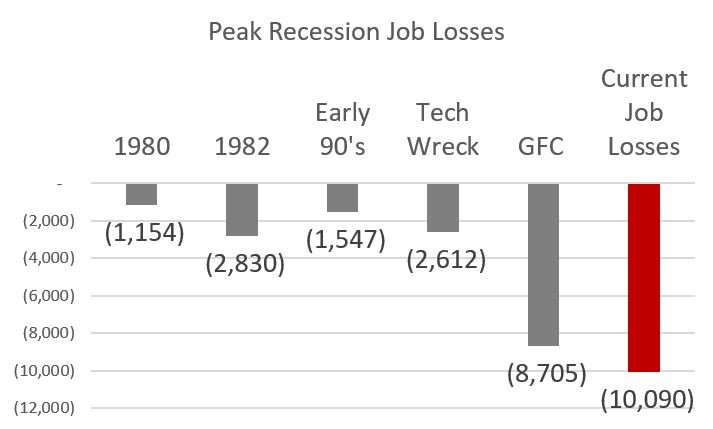
1. Total
Jobs Lost
The number of people employed is 10.1 million less than before the recent economic downturn.
To provide perspective, the chart below shows the maximum number
of jobs lost during the previous five recessions along with the current downturn’s
remaining job losses.
The current number of remaining job losses remains
significantly greater than the five previous recessions.
Source: St. Louis Federal Reserve
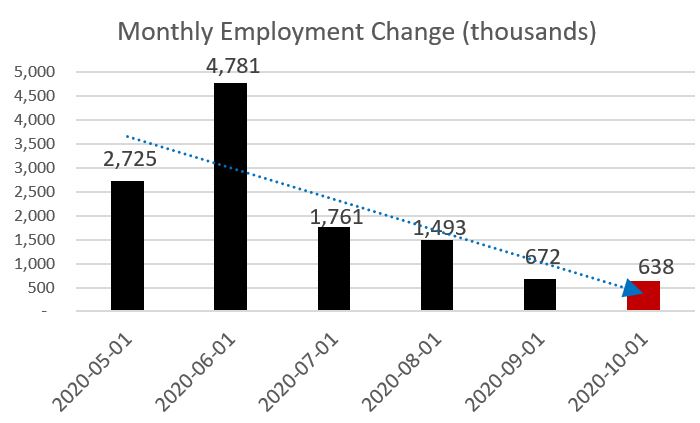
2. Monthly
Job Change
October saw a 638,000 increase in the number of people employed.
If the economy were to continue adding 638,000 jobs per month, it would take until until February of 2022 to return to pre-COVID employment levels.
Importantly, 200,000 of October job gains were restaurant related. With winter coming and COVID infections already surging, maintaining 600,000 job gains per month becomes less likely increasing the time to return to previous employment levels further into 2022.
Source: St. Louis Federal Reserve
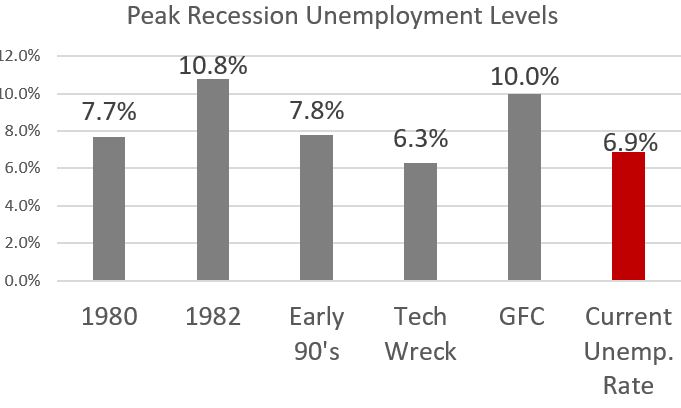
3. Unemployment
The unemployment rate is 6.9%, down from a peak of 14.7% in April but up from the pre-COVID level of 3.5%.
To provide perspective, the chart below shows the maximum unemployment
rate during the previous five recessions along with the current downturn’s unemployment
rate.
Source: St. Louis Federal Reserve
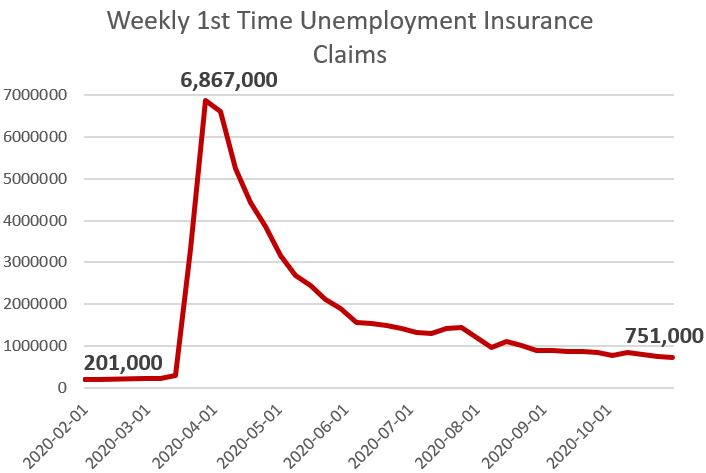
4. 1st
Time Unemployment Insurance Claims
The number of 1st time unemployment insurance claims was 751,000 in the week ending October 24th. This is down from a peak of 6.9 million in the week ending March 28th and up from the pre-COVID level of 282,000.
Source: St. Louis Federal Reserve
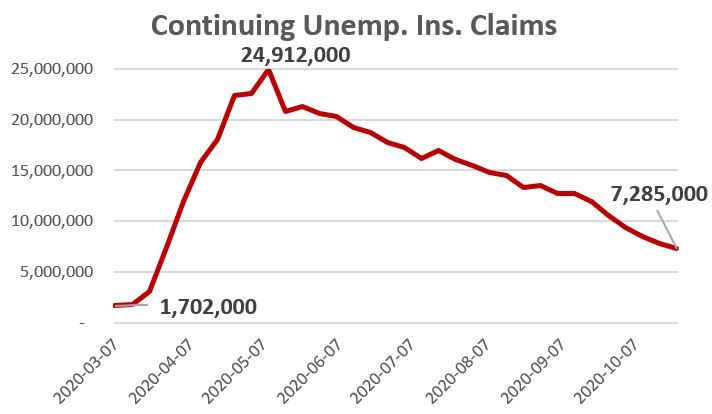
5. Continuing
Unemployment Insurance Claims
The number of continuing unemployment insurance claims was 7.3 million million in the week ending October 24th. This is down from a peak of nearly 21 million in the week ending May 16th but remaining up significantly from pre-COVID levels .
Source: St. Louis Federal Reserve
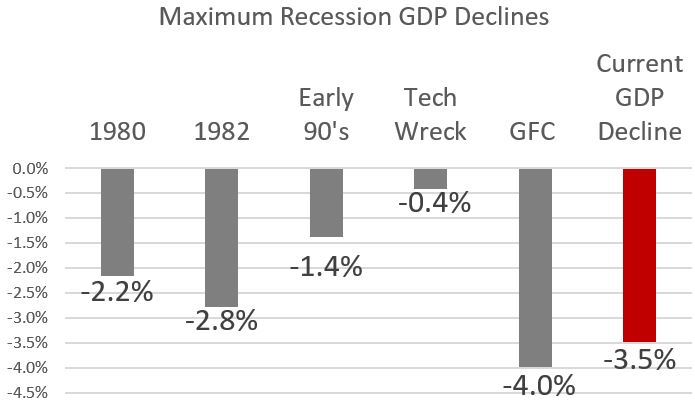
Gross Domestic Product
6. GDP Change
GDP remains 3.5% less than before the current economic downturn.
To provide perspective, the chart below shows the maximum decline
in GDP during the previous five recessions along with the current downturn’s decline
in GDP.
The current reduction in GDP remains significantly greater than four of the five previous recessions.
Source: St. Louis Federal Reserve
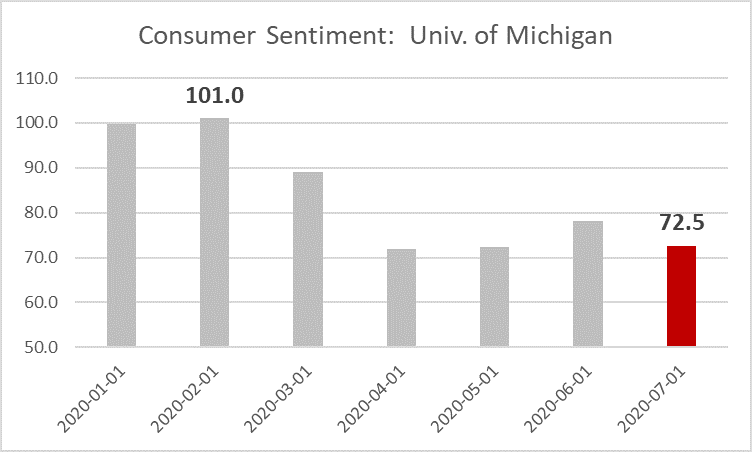
Consumer Sentiment
7. University
of Michigan Consumer Sentiment survey
At 74.1, consumer sentiment is up marginally from its recent low of 71.8 but remains down significantly from its pre-COVID peak of 101.
Source: St. Louis Federal Reserve
Stay in the know:
Receive unique insights into the economy, global trade, and financial markets you can use in investing, in your business, and evaluating Presidential candidate policies.

 Read More